|
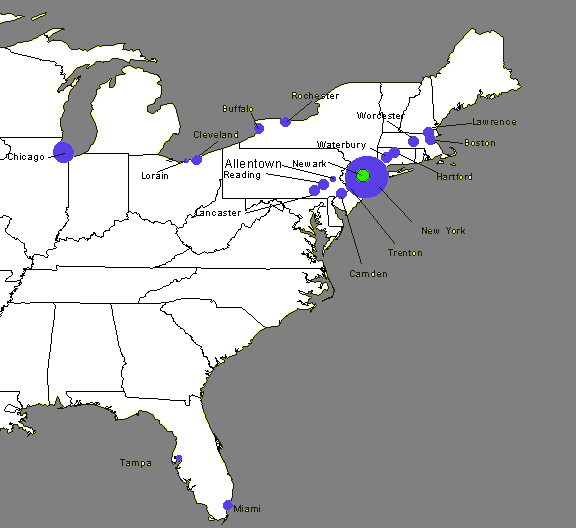
Approximately 90 percent of the Puerto Rican population
in the United States lives in 30 cities, most of them in the eastern
states along the Atlantic seaboard. The city with the largest concentration
of Puerto Ricans is New York, followed by Chicago, Philadelphia, Newark
and Hartford. New York has approximately 890,000 Puerto Ricans and still
leads all other cities by a large margin, but the number of Puerto Ricans
living there did not increase significantly during the 1980s. It is
possible that in the next Census (2000) the actual number of Puerto
Ricans living in New York may actually fall. A number of articles in
the press have reported an exodus of Puerto Ricans to smaller cities
in Pennsylvania and Florida, where living conditions for families rasing
children appear to me more attractive. That, in any case, is what multipe
individuals reported to journalists inquiring about the exodus from
New York.
|
|
City
|
State
|
Puerto Rican Population in 1980
|
Percent of Total U.S. Puerto Rican Population
in 1980
|
Puerto Rican Population in 1990
|
Percent of Total U.S. Puerto Rican Population
in 1990
|
Yearly Population Growth 1980-1990
|
|
New York
|
NY
|
860,552
|
42.73%
|
896,763
|
32.87%
|
0.41%
|
|
Chicago
|
IL
|
112,074
|
5.56%
|
119,866
|
4.39%
|
0.67%
|
|
Philadelphia
|
PA
|
46,587
|
2.31%
|
67,857
|
2.49%
|
3.83%
|
|
Newark
|
NJ
|
39,372
|
1.95%
|
41,545
|
1.52%
|
0.54%
|
|
Hartford
|
CT
|
24,615
|
1.22%
|
38,176
|
1.40%
|
4.49%
|
|
Jersey City
|
NJ
|
26,830
|
1.33%
|
30,950
|
1.13%
|
1.44%
|
|
Bridgeport
|
CT
|
22,146
|
1.10%
|
30,250
|
1.11%
|
3.17%
|
|
Paterson
|
NJ
|
24,326
|
1.21%
|
27,580
|
1.01%
|
1.26%
|
|
Boston
|
MA
|
18,899
|
0.94%
|
25,767
|
0.94%
|
3.15%
|
|
Springfield
|
MA
|
12,298
|
0.61%
|
23,729
|
0.87%
|
6.79%
|
|
Camden
|
NJ
|
|
0.00%
|
22,984
|
0.84%
|
|
|
Cleveland
|
OH
|
12,267
|
0.61%
|
17,829
|
0.65%
|
3.81%
|
|
Rochester
|
NY
|
10,545
|
0.52%
|
16,383
|
0.60%
|
4.50%
|
|
Lawrence
|
MA
|
5,726
|
0.28%
|
14,661
|
0.54%
|
9.86%
|
|
Yonkers
|
NY
|
|
0.00%
|
14,420
|
0.53%
|
|
|
Los Angeles
|
CA
|
13,835
|
0.69%
|
14,367
|
0.53%
|
0.38%
|
|
Buffalo
|
NY
|
6,865
|
0.34%
|
12,798
|
0.47%
|
6.43%
|
|
Worcester
|
MA
|
5,433
|
0.27%
|
12,165
|
0.45%
|
8.39%
|
|
Waterbury
|
CT
|
5,819
|
0.29%
|
12,080
|
0.44%
|
7.58%
|
|
Elizabeth
|
NJ
|
|
0.00%
|
12,062
|
0.44%
|
|
|
Miami
|
FL
|
12,320
|
0.61%
|
12,004
|
0.44%
|
-0.26%
|
|
Passaic
|
NJ
|
10,529
|
0.52%
|
11,626
|
0.43%
|
1.00%
|
|
Reading
|
PA
|
6,957
|
0.35%
|
11,612
|
0.43%
|
5.26%
|
|
New Britain
|
CT
|
5,358
|
0.27%
|
10,325
|
0.38%
|
6.78%
|
|
Lancaster
|
PA
|
5,967
|
0.30%
|
10,305
|
0.38%
|
5.62%
|
|
Tampa
|
FL
|
4,038
|
0.20%
|
9,863
|
0.36%
|
9.34%
|
|
Allentown
|
PA
|
4,279
|
0.21%
|
9,670
|
0.35%
|
8.49%
|
|
Lorain
|
Ohio
|
8,033
|
0.40%
|
9,382
|
0.34%
|
1.56%
|
|
Trenton
|
NJ
|
6,148
|
0.31%
|
9,350
|
0.34%
|
4.28%
|
|
Top Cities
|
|
1,311,818
|
65.13%
|
1,546,369
|
56.69%
|
1.66%
|
|
PRUSA
|
|
2,014,000
|
100.00%
|
2,728,000
|
100.00%
|
3.08%
|
|
Source: Francisco Rivera Batiz
and Carlos Santiago, Puerto Ricans in the United States, a
Changing Reality (Washington: National Puerto Rican Coalition,
Inc., 1994), p.22.
|
|
